Client work, anonymized. Sectors are real; names, dates, and identifying details are withheld.
Which signals actually predict a sale
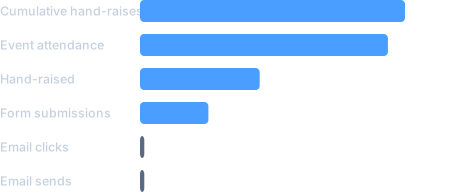
A lead scoring model asked which prospect behaviors carried real weight. Repeated hand-raises and event attendance mattered most. Email sends and clicks barely registered, which changed where the sales team spent its time.
Illustrative coefficients, approximated for display. Not raw model output.
Home furnishings retail
The rarest first purchase was the most valuable one
23xMedian spend of customers buying across all five product categories, versus single-category buyers.
Five years of transactions showed that category breadth, not order count, drove customer value. Fewer than 2% of customers started with a dining table, yet those who did had a 64% chance of buying again and 55% higher five-year value than the most common entry point.
1 category · 51% of customers$307
2 categories · 31%$1,146
3 categories · 15%$2,369
4 categories · 3%$4,338
5 categories · 0.3%$7,385
Median spend by number of categories purchased.
Discount retail
Proving a digital circular sold more than it cost
$5.52Incremental revenue per media dollar, measured against a matched unexposed control.
A matched-control study on card-transaction data showed the mobile circular pulled in new buyers and took share from rival chains. It also showed the frequency cap was holding it back: households that saw it more often had 13% higher lift.
Media budget$800K
Incremental revenue$4.4M
Buyer penetration
+3.9%
New-buyer penetration
+25%
Share of wallet
+2.1%
Lift versus matched control over a nine-week program.
Specialty apparel retail
When a new brand quietly costs the old one
−30%Flagship email revenue versus its expected trend after an outlet sister brand launched.
There was no holdout, so matched comparison programs and a Bayesian structural time series model built the counterfactual. Opens held steady while clicks and revenue fell, which ruled out creative and deliverability. Demand was moving to the sister brand, roughly $28M over the period.
Unique open rate+1%
Click-through rate−10%
Daily sessions−12%
Daily revenue−30%
−60%−30%0
Effect versus expected trend. Dots are estimates; bars are 95% intervals.
Advisory
I take on a small number of advisory engagements each year. If that's what you're looking for, email me.